| Panel Rating | Product | Brand or Type | Manufacturer | Sample Size | Temperature |
|---|---|---|---|---|---|
| 1 | Cream Cheese | Philadelphia | Kraft Foods | ½ inch | 45-55°F |
| 2 | Egg White | Hard cooked, 5 mins. | ½ tip | room | |
| 3 | Frankfurters | Large, uncooked, skinless | Mogen David Kosher Meat Products Corp. | ½ inch | 50-65°F |
| 4 | Cheese | Yellow, American, pasteurized process | Kraft Foods | ½ inch | 50-65°F |
| 5 | Olives | Exquisite giant size, stuffed | Cresca Co. | 1 olive | 50-65°F |
| 6 | Peanuts | Cocktail type in vacuum tin | Planter’s Peanuts | 5 nuts | room |
| 7 | Carrots | Uncooked, fresh | ½ inch | room | |
| 8 | Peanut Brittle | Candy part | Kraft Foods | 1 piece | room |
| 9 | Carrots | Dryden & Palmer | 1 piece | room |
The original scales had 5 to 7 points. Today’s scales commonly use a 15 point intensity ranking. Adaptations have been made to the original classifications to capture the language needed to describe specific products such as greasiness of potato chips. Textural profile analysis is an evolving tool used to accurately describe the textural characteristics of food or other products. Debate continues over use of a trained sensory panel (organoleptic) vs specialized equipment (instrumentation).
Function
A quantitative scale has been created for each textural attribute.1
The primary categories for texture profile analysis are:
- Hardness: the initial force used to deform2
- Cohesiveness: how the item holds together2
- Viscosity: flow rate2
- Elasticity (Springiness): the rate at which a deformed item reforms2
- Adhesiveness: rate at which item comes away from probe(instrumental) or roof of mouth/teeth (organoleptic)2
The primary categories can be further broken down into secondary categories:
- Resilience: measurement of how a sample recovers from deformation in relation to speed and forces derived.
- Brittleness (Fracturability): the initial force needed for a material to fracture2
- Chewiness: energy required to chew a solid food until it is ready for swallowing2
- Gumminess: energy required to disintegrate a semisolid food until it is ready to swallow2
The primary and secondary categories may be further broken down as needed to define the characteristics in a specific food item.2 For example, mouth coating and melt rate are used to describe ice cream much better than hardness or chewiness.
Using specialized equipment, a food sample is placed in the equipment and compressed. This action mimics chewing and creates the force deformation curve.3 The force of the first bite and the force of the second bite are measured against the amount of deformation of the food sample for analysis.3 All textural attributes are analyzed by the instrument software. The food samples must be prepared in exactly the same way to get consistent results. The test is usually repeated up to 15 times for statistical accuracy.4
Application
Textural profile analysis testing is also known as the “Two Bite Test.” The test mimics the mouth’s biting activity allowing analysis of how food responds when chewed. The Two Bite testing method allows for multiple textures to be analyzed in one test. The test results are plotted on a graph as seen in figure 1.
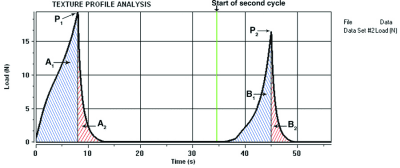
TPA Force vs Time (Figure 1)5
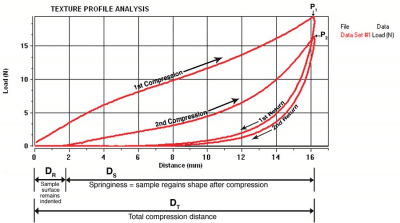
The force vs time graph (Figure 1) shows the force peak resulting from each compression cycle. This is a typical 2-cycle TPA curve obtained from any load bearing instrument. While the force vs distance graph (Figure 2) better displays the response of the sample to the application and removal of strain. The following are typical measurements obtained from a TPA curve5:
- Hardness: P1
- Springiness: Ds / Dt
- Resilience: A2/A1
- Cohesiveness: B1/A1
- Chewiness: (B1/A1) x P1 x Ds
- Gumminess: P1 x B1/A1
Texture profile analysis is used to accurately describe the textural characteristics of food. This technique provides a universal language for food scientists, vendors, sales staff, and customers. Knowing the textural profile of a product can determine the attributes that increase consumer liking.
References
- Szczesniak, Alina Surmacka, Margaret A. Brandt, and Herman H. Friedman. “Development of Standard Rating Scales for Mechanical Parameters of Texture and Correlation Between the Objective and the Sensory Methods of Texture Evaluation.” Journal of Food Science 28.4 (1963).
- Szczesniak, Alina Surmacka. “Classification of Textural Characteristics.” Journal of Food Science 28.4 (1963).
- Peleg, M. “Texture Profile Analysis Parameters Obtained By An Instron Universal Testing Machine.” Journal of Food Science 41.3 (1976).
- Otegbayo, Bolanle, Johnson Aina, Lawrence Abbey, Esther Sakyi‐Dawson, Mpoko Bokanga, And Robert Asiedu. “Texture Profile Analysis Applied To Pounded Yam.” Journal of Texture Studies 38.3 (2007).
- Overview of Texture Profile Analysis (TPA). Texture Technologies. https://texturetechnologies.com/resources/texture-profile-analysis