How does it work?
Thermal profiling measures key variables involved in thermal processing of foods and bakery products. It measures things such as:
- Internal product temperature over process time is done at one or more points of interest with sensors, and graphical plotting of temperature-time curve.1
- Convective and radiant heat fluxes used to bake the products (Btu/hr·ft2 or W/m2).1
- Total heat absorbed by the product during total bake time (Btu/ft2 or Joules/m2).
- Air velocity in convection ovens (m/s or fpm) and oven (air) temperature (°C/°F).
- Oven humidity as humidity mass ratio in lb water/lb dry air (kg water/kg dry air).
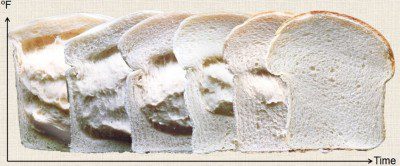
The fundamental principle of thermal profiling lies in the fact that physical, microbiological and chemical changes in the product during thermal processing occur as a function of internal temperature. Taking the baking step as example, dough enters the oven at normal proofing temperature of 35°C (96°F) and exits as bread at 93°C ( 200°F).
Changes taking place during baking encompass 4 major points:2,3
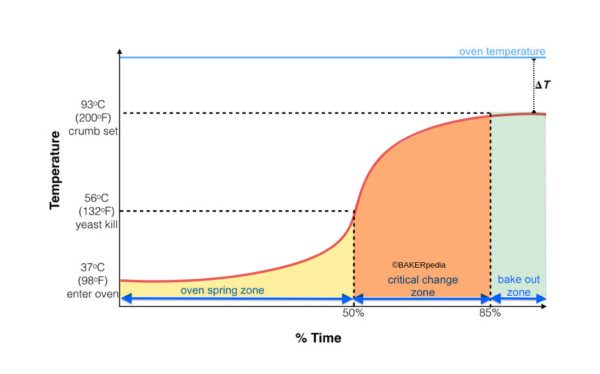
- Yeast kill or deactivation: yeast cells in the dough are inactivated at 132°F/56°C. This happens after the product has passed the oven spring stage, the maximum expansion from yeast activity while dough matrix is still stretchable. Ensuring complete yeast kill should take 45–55% of total bake time.
- Critical change zone: the transition from a viscoelastic dough to a firm, drier and porous or sponge structure.
- Wheat starch gelatinization: starch granules gelatinization onset is at 65°C (150°F) and is concluded at 82°C (180°F). This process should be completed at 60% of total bake time.
- Gluten protein denaturation: gluten proteins unfold, re-associate and solidify at 160–185°F (71–85°C).
- Arrival to final product temperature: for a complete bake out so the crumb can set, the temperature of the loaf center should reach about 93°C (200°F) at standard atmospheric conditions.
- This process should occur at 80–90% of total bake time.
- Crust color development: final 10–15% of bake time should provide good crust color through Maillard browning and caramelization reactions.
Performing a thermal profile, and knowing what is happening in the oven, is critical to controlling the quality of the product. Excessive moisture loss results in a dry, crumbly product that’s prone to high staling rates. Inadequate bake out leaves too much moisture in the product, resulting in a gummy product that takes a longer time to cool. Too much moisture enhances microbial spoilage.3

Application
Elements needed for thermal profiling:
- Product to profile (dough or batter)
- Oven (batch or continuous)
- Stopwatch for process time control
- Profiler (data logger)
- Product sensors (insertion thermocouples) and air sensors (humidity, air velocity, heat flux)
- Insulation box as thermal barrier for profiler
- Gloves (for safe handling of hot surfaces)
- Cooling fan
- Computer
- Profiling software for data analysis and record keeping
Steps for determining baking thermal profile:
- Connect sensors (for product and air) to data logger inputs (channels)
- Insert sensors inside the test product (product core is the target). Air sensors are usually attached to the profiler’s body or come integrated with insertion thermocouples in a single probe to be exposed to the oven atmosphere.
- Turn on data logger and press record button to start recording data
- Place the thermal profiler inside the insulation box
- Place the protected profiler and test products inside the oven (place them on the oven band, hearth or sheet pan)
- Collect data during baking cycle
- Run and complete baking cycle
- Once bake time is completed, retrieve data logger from the oven (using gloves) and remove inserted thermocouples from test product
- Disconnect profiler from sensors
- Cool data logger with fan or allow it cool down naturally
- Remove data logger from thermal barrier
- Stop recording by pressing the record button
- Connect data logger to computer (USB connection)
- Open profiler software (it automatically graphs data collected during the test). Depending on the profiling equipment used, profiles for product temperature, air temperature, air velocity, air humidity and heat flux can be obtained.
Interpreting results from thermal profiling
Using this baking example, data collected and processed by the thermal profiling software is displayed as a temperature/time plot known as the S-curve. It explains how the product responds to oven settings. In this curve all the 4 major stages can be seen graphically.

References
- Davidson, I. “Oven Inspection and Audit.” Biscuit Baking Technology: Processing and Engineering Manual, 2nd edition, Academic Press, Elsevier Inc., 2016, pp. 285–288.
- Labensky, S.R., and Martel, P. “Principles of Baking.” On baking: A Textbook of Baking and Pastry Fundamentals, 3rd edition Update, Pearson Education, Inc., 2016, pp. 48–56.
- Delcour J.A., and Hoseney, R.C. “Yeast-Leavened Products.” Principles of Cereal Science and Technology, 3rd edition, AACC International, Inc., 2010, pp. 151–176.

