Origin
C-Cell’s origins were first defined as part of a privately funded research program between Campden BRI and Warburtons bakers in 2000 looking at machine vision to quantify crumb structure. In 2001 Calibre commercialized this research and launched the first monochrome system.
How does it work?
The C-Cell digitally captures an image of a sliced section of a bread or cake product. It then digitally analyzes the image for critical crumb attributes such as cell size, structure, color, uniformity, while comparing it to standard crumb scores.
Application
- C-Cell must be calibrated upon switching on. This is a 2-minute procedure.
- The sliced product is placed in the sample drawer. It is important the slice has a clean cut and the surface being imaged is level with the top of the draw (12mm)
- A high definition image (monochrome or color, depending on model) is taken.
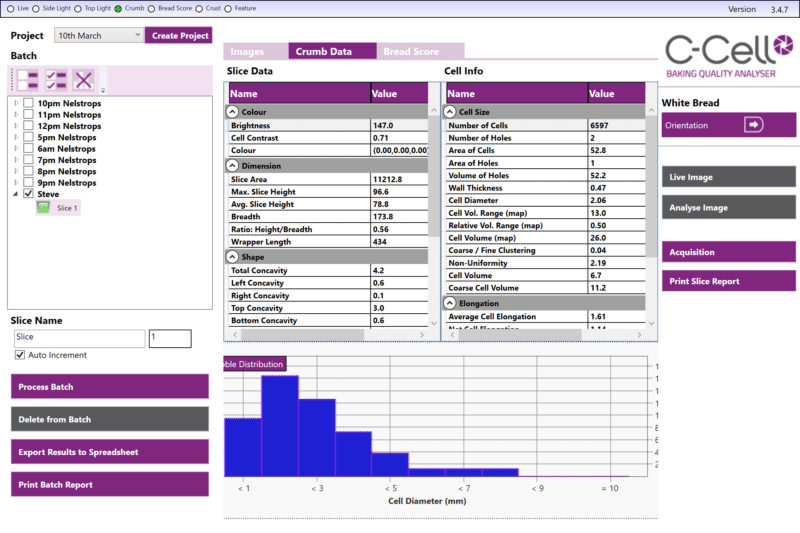
- The image (2 images for color) is analyzed in a bespoke program that creates the following sub-groups:
- Dimensions
- Shape
- Cell Size
- Elongation
- Color
In total Cell will measure:
- Monochrome: 48 parameters
- Color: 60 parameters
All “raw” images and batch analysis results are saved. Processed images / Print reports / exported spreadsheets are optional items to save.
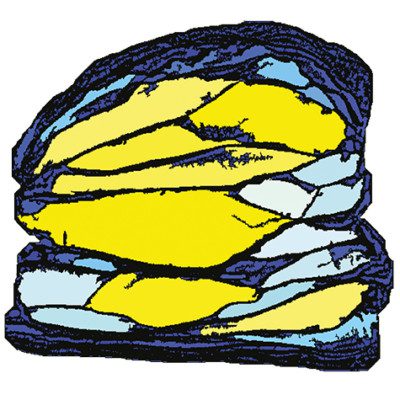
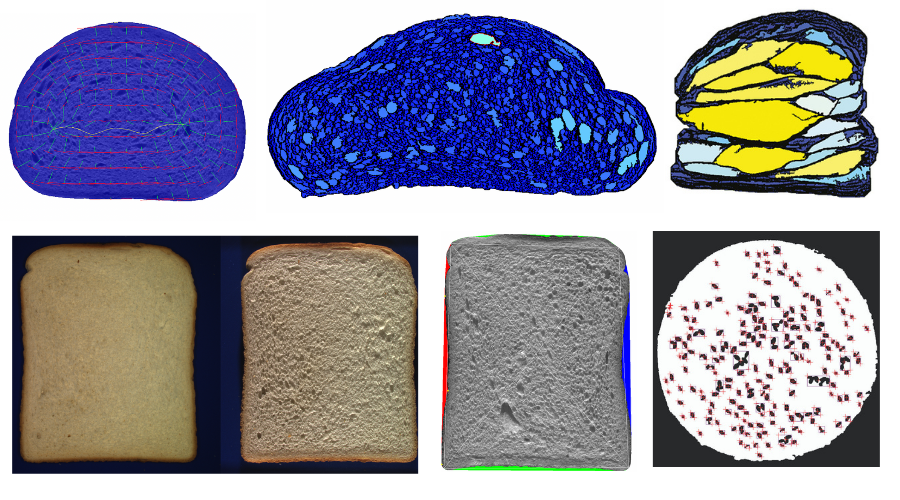
Examples of processed images
Sample Report
AACC International Method 10-18.01.2
- Switch the instrument and computer on, leave for 30 minutes before using to allow system to warm up.
- Calibrate using the single or double calibration card.
- Monochrome uses 1 solid grey image.
- Color uses 2, solid grey and ramp card on reverse.
- Place sample slice in drawer, making sure:
- Orientation is set to correct direction.
- Slice has clean cut surface.
- Surface being imaged is level with top of draw (12mm)
- Snap image(s) and save to file or add to batch.
- Analyze sample or batch and save data.
- Define what information is required in print format or Excel file.
Sub Groups
Each sub-group contains several parameters.
- Dimensions
- Slice area
- Max Slice height
- Average Slice height
- Breadth (Width)
- Ration (Height:Width)
- Wrapper length (Circumference)
- Shape
- Total Concavity
- Left Concavity
- Right Concavity
- Bottom Concavity
- Left Break
- Right Break
- Left Break Height
- Right Break height
- Left Break Depth
- Right Break Depth
- Left break position
- Right Break position
- Top left shoulder
- Top right shoulder
- Bottom left roundness
- Bottom right roundness
- Cell Size
- Number of Cells
- Number of Holes
- Area of Cells
- Area of Holes
- Volume of holes
- Wall Thickness
- Cell Diameter
- Cell Vol. Range (map)
- Relative Vol. Range (map)
- Cell Volume (map)
- Coarse / Fine Clustering
- Non-Uniformity
- Cell Volume
- Coarse Cell Volume
- Elongation
- Average Cell Elongation
- Net Cell Elongation
- Cell Angle to Vertical
- Cell Alignment
- Vertical Elongation
- Degree of Circulation
- Circulation Horizontal Offset
- Circulation Vertical Offset
- Curvature
- Color
- Brightness
- Contrast
- Crumb color (L*a*b*)
- Crust color – Top
- Crust thickness – Top
- Crust color – Left
- Crust Thickness – Left
- Crust Color – Right
- Crust Thickness – Right
- Crust Color – Bottom
- Crust Thickness – Bottom
References
- Cauvain, S.P. .The C-Cell image analysis system for objective measurement of bread quality. Proceedings of the ICC-SA/SACB Bread and Cereal Symposium, Johannesburg, South Africa ,2004, pp: 396-402.
- AACC Method 10-18-01. Measurement of crumb structure of baked products by C-Cell. Baking Quality. AACC Approved Methods of Analysis, 11th edition.